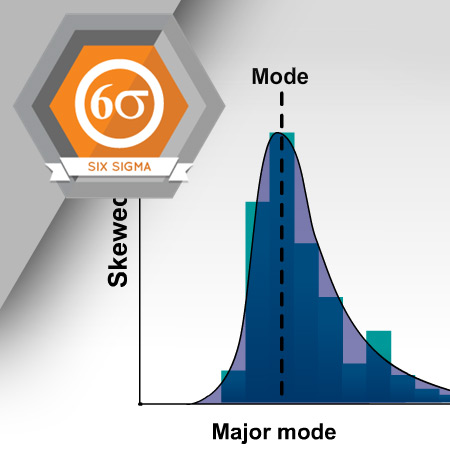
A random experiment or sample can result in different outcomes. The probability that each outcome will occur can be calculated and charted using different probability distributions.
Estimated completion time (hours): 2.2
Objectives
By the end of this course, you will be able to do the following:
- Describe and interpret normal, binomial, Poisson, t, chi square, and F distributions
- Identify formulas for calculating the probability of data values of different probability distributions
- Six Sigma Green Belt
Estimated Time (Hrs): 2.2
Language: English
